PUNCH 3 Science Meeting August 12th, 2022

We invited the community to the third PUNCH (Polarimeter to UNify the Corona and Heliosphere) Science Meeting (August 12th, 2022). Attendance was high and the attendees were highly engaged. PUNCH is an in-development NASA mission that will image the outer corona and solar wind throughout the inner heliosphere. Major science topics included the origin and evolution of the ambient solar wind and turbulence within it, mission outreach, and the physics, tracking, and predictability of transient events including CMEs, CIRs, and shocks.
The meeting was in person and held immediately after the Triennial Earth-Sun Summit meeting in Bellevue, Washington.
Agenda & Presentations
All times are Pacific time zone
Presentation links open in a new tab
8:30-12:30, Plenary Session (in the auditorium on floor 3 on the opposite side of the atrium from TESS)
- 8:30-10:15, Plenary 1 – PUNCH status updates
- Mission (PPT, 334 MB) (Craig DeForest)
- NFI (PPT, 72 MB) (Robin Colaninno)
- WFI (PPT, 64 MB) (Glenn Laurent)
- STEAM (PPT, 42 MB) (Mary Hanson, Gabriela Galarraga, Samantha Honan)
- Discussion
- 10:15-10:45, Break
- 10:45-12:30, Plenary 2 - Analysis tools and program development
- Science and overview of analysis tools (PPT, 19 MB) (Sarah Gibson)
- Flow mapping tools (Raphael Attie and Bea Gallardo-Lacourt)
- SOC (Keynote, 82 MB) - (Dan Seaton)
- Outreach (PPT, 130 MB) (Cherilynn Morrow)
- Discussion
12:30-13:30, Catered Lunch
13:30-17:40, Breakout Sessions (Auditorium and Larch room, decided during morning session)
- 13:30-15:20, Breakout 1 Sessions
We will describe the recent efforts to identify flows in imaging data. This will begin with a summary of
the TESS session ‘Tracking Flows in the Heliosphere’, and follow with a discussion the identified outstanding
problems and prospects for future flows as measured by PUNCH.
In this breakout session, we will talk about CME and CIR analysis with upcoming PUNCH data.
At present, we have several synthetic datasets that emulate PUNCH observations. We will talk
about properties of the data, where to get them, and discuss projection issues. After a brief
introduction to the synthetic data, we will spend time in an open discussion on what projects
can, and should be done pre-launch with these synthetic observations. Participants who wish
to discuss their own projects are encouraged to bring 1-2 slides and give a 5-minutes
SHINE-style introduction to their project.
Please see the CME Tracking Challenge.
Topics for CIR discussion (see figures below)
1. What is the measured total brightness telling us about CIRs?
2. Is this reality being captured by the models?
3. Do we need to adjust the models and boundary conditions to better capture reality?
If anyone has any thoughts they want to share on these questions, please come prepared with a slide or two to
show during the CIR breakout session.
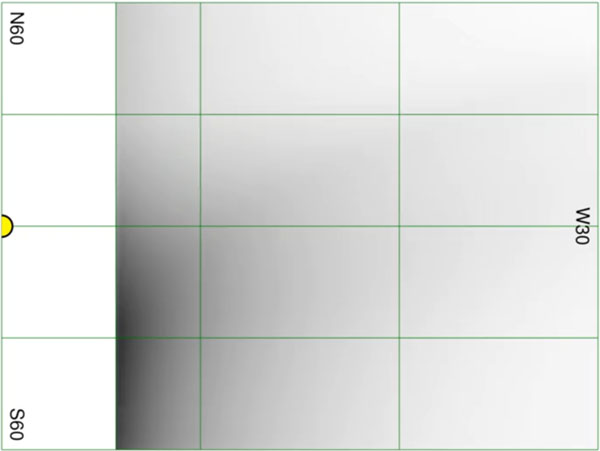
Figure 1: Total brightness image generated from a simple, tilted streamer belt.
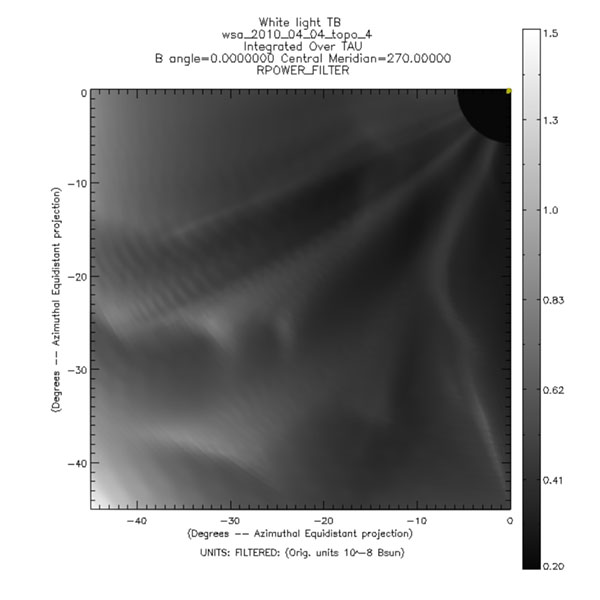
Figure 2: Total brightness image (with a radial filter applied) generated from a detailed
model of the solar wind.
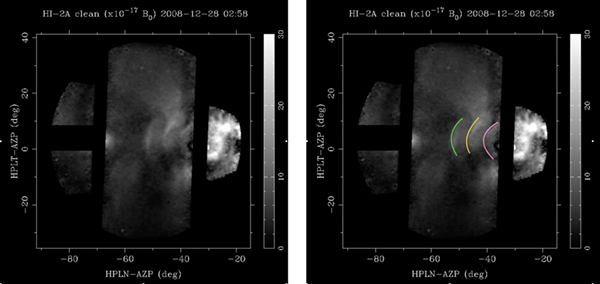
Figure 3: Total brightness image measured by stereo on 2008-12-28. The righthand image
is a copy of the lefthand image with the features of interest marked by the colored arcs.
- 15:20-15:50, Break
- 15:50-17:40, Breakout 2 Sessions
At the PUNCH Science Team Meeting on Friday August 12th, 2002 t from 16:00 to 18:00 Pacific Time, we have a breakout
group for Working Group 2c (shocks) entitled Multipoint Measurement and Tomography (2D Shocks). Our overarching plan
for this session is to have an open forum (similar to SHINE sessions) to discuss how we can use PUNCH and other
observations to obtain shock structure and properties.
To determine the evolution of the shock front structure (and CIR structure) from the PUNCH observations is not
straightforward. In order to understand the shock physics and associated SEP acceleration, we need to develop tools
to use PUNCH and other data sets to provide information on plasma and field properties. We need to learn as much as
we can about the solar wind properties and field structure including the compression rations and field orientations.
From PUNCH observations we will learn primarily about the speed and density of the solar wind. To determine more
field information, we likely need to create tools and models which assimilate observations from multiple sources
(e.g. 3-D reconstructions from interplanetary scintillations (IPS) which include heliospheric imaging observations).
We need to assess what resolution and accuracies do we need in order to extract meaningful information about the SEP
acceleration at shocks either directly or indirectly from PUNCH observations. For instances, how accurately do we need
to know compression ratios and field orientations. We want to know if can we develop the ability to forecast SEPs from
PUNCH observations.
Below are our current volunteer presenters and Mihir and I are looking for additional presenters.
- Heather Elliott and Mihir Desai
Current Volunteers:
Mihir Desai - introduction and shock properties that lead to SEP acceleration
Heather Elliott - Estimating solar wind density, temperature and field strength, directly from PUNCH flows
Bernie Jackson - IPS time-dependent kinematic 3-D reconstructions.
We will discuss recent effort to model density turbulence as PUNCH will image it. We will also discuss methods
to measure turbulence characteristics in the PUNCH data, and how to identify and characterize density structures
that form in the corona and advect with the ambient solar wind.
17:40-18:00, Plenary Close-out Session (Auditorium)
13:30-17:40, Breakout Sessions (Auditorium and Larch room, decided during morning session)
- 13:30-15:20, Breakout 1 Sessions
- 15:20-15:50, Break
- 15:50-17:40, Breakout 2 Sessions
We will describe the recent efforts to identify flows in imaging data. This will begin with a summary of the TESS session ‘Tracking Flows in the Heliosphere’, and follow with a discussion the identified outstanding problems and prospects for future flows as measured by PUNCH.
In this breakout session, we will talk about CME and CIR analysis with upcoming PUNCH data. At present, we have several synthetic datasets that emulate PUNCH observations. We will talk about properties of the data, where to get them, and discuss projection issues. After a brief introduction to the synthetic data, we will spend time in an open discussion on what projects can, and should be done pre-launch with these synthetic observations. Participants who wish to discuss their own projects are encouraged to bring 1-2 slides and give a 5-minutes SHINE-style introduction to their project.
Please see the CME Tracking Challenge.
Topics for CIR discussion (see figures below)
1. What is the measured total brightness telling us about CIRs?
2. Is this reality being captured by the models?
3. Do we need to adjust the models and boundary conditions to better capture reality?
If anyone has any thoughts they want to share on these questions, please come prepared with a slide or two to show during the CIR breakout session.
Figure 1: Total brightness image generated from a simple, tilted streamer belt.
Figure 2: Total brightness image (with a radial filter applied) generated from a detailed model of the solar wind.
Figure 3: Total brightness image measured by stereo on 2008-12-28. The righthand image is a copy of the lefthand image with the features of interest marked by the colored arcs.
At the PUNCH Science Team Meeting on Friday August 12th, 2002 t from 16:00 to 18:00 Pacific Time, we have a breakout group for Working Group 2c (shocks) entitled Multipoint Measurement and Tomography (2D Shocks). Our overarching plan for this session is to have an open forum (similar to SHINE sessions) to discuss how we can use PUNCH and other observations to obtain shock structure and properties.
To determine the evolution of the shock front structure (and CIR structure) from the PUNCH observations is not straightforward. In order to understand the shock physics and associated SEP acceleration, we need to develop tools to use PUNCH and other data sets to provide information on plasma and field properties. We need to learn as much as we can about the solar wind properties and field structure including the compression rations and field orientations. From PUNCH observations we will learn primarily about the speed and density of the solar wind. To determine more field information, we likely need to create tools and models which assimilate observations from multiple sources (e.g. 3-D reconstructions from interplanetary scintillations (IPS) which include heliospheric imaging observations).
We need to assess what resolution and accuracies do we need in order to extract meaningful information about the SEP acceleration at shocks either directly or indirectly from PUNCH observations. For instances, how accurately do we need to know compression ratios and field orientations. We want to know if can we develop the ability to forecast SEPs from PUNCH observations.
Below are our current volunteer presenters and Mihir and I are looking for additional presenters.
- Heather Elliott and Mihir Desai
Current Volunteers:
Mihir Desai - introduction and shock properties that lead to SEP acceleration
Heather Elliott - Estimating solar wind density, temperature and field strength, directly from PUNCH flows
Bernie Jackson - IPS time-dependent kinematic 3-D reconstructions.
We will discuss recent effort to model density turbulence as PUNCH will image it. We will also discuss methods to measure turbulence characteristics in the PUNCH data, and how to identify and characterize density structures that form in the corona and advect with the ambient solar wind.